Documenting Patch Panels
As I discussed previously, network documentation is important. One part of that is documenting all the physical cabling of a building.
I had started drawing out visio diagrams for each of our patch panels, indicating where the cable went, as well as floorplans marking all the ethernet ports. The floor plans aren’t too bad, especially if you can get CAD drawings of the building. But the patch panels turned out to be a pain - positioning labels over each port on a patch panel is very time consuming.
So I decided to write a plugin for DokuWiki that will do the hard work for me. I give it a simple description like this:
<patchpanel groups="6" name="Top_of_Rack" ports="24" rows="2">
# Port Label (#COLOR) Comment
1 Uplink #ff0000 Connects to firewall
2 2 Office 101
3 3 Office 102
4 4 Office 103
5 5 Office 104
24 24 Reception desk
</patchpanel>
And I get a drawing like this:
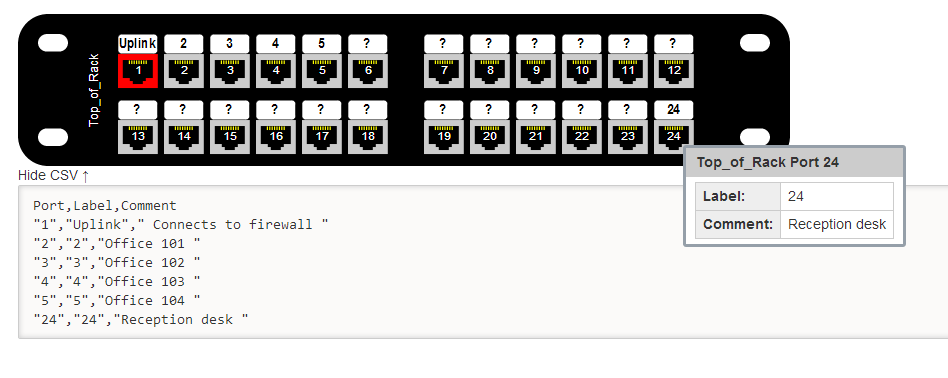
The plugin allows you to specify the name, number of ports, number of rows, and port grouping of the patch panel, so it looks pretty close to the real thing. For each port, you can specify a label, optional color, and a comment. The comments are shown as tooltips when you hover over a port.
This saves me a ton of time over updating visio diagrams, and means I don’t have to edit the visio diagram, export it as an image, and upload it to our wiki. Just edit a few lines of text when a port changes. I’m also planning on writing one to handle switches,
The image is actually an embedded SVG. The amazing things about scalable vector graphics is that they are text based descriptions of what to draw - so with a little bit of effort, you can dynamically create an image in any programming language, without any special image manipulation libraries.
If you are interested in using this plugin, you’ll find it at https://www.dokuwiki.org/plugin:patchpanel
Bug reports and feature requests should be added to the github repo.